Summary
College closure can cause significant distress to currently enrolled students as they have to transfer to a new school where their previous credits may not be honored. Given the huge public and private investments into post-secondary education, I developed a model that tries to predict whether a college would close by 2017 from Department of Education data from 2013. During this time, there were several high profile closures of colleges, particularly for-profit private colleges with shady practices.
I obtained the data I used from the College Scorecard API and stored it in a Postgres SQL database. A Random Forest model provides the best predictions of college closure in 2017, although there may be leakage problems in the data that artificially improve the predictions. In addition, the closure of ITT Tech accounted for nearly 16% of the positive class, but removing this school from the data did not negatively affect the predictions.
Since this model was backward-looking, I used the predicted (if uncalibrated) probabilities from the Random Forest model to assess the risk of a college closing in the future as "low", "moderate", or "high". I created a d3.js map that lets you explore which colleges are most at risk, which apparently includes lots of barber colleges.
The code for this project can be found here.
Overview
College and other forms of post-secondary education (like data science bootcamps!) are increasingly a necessary investment to obtain and maintain the competitive skills in the labor market. Furthermore, an educated populace is important so that civic society can properly evaluate the complex trade offs involved in various economic, social, and geopolitical issues. Given both its public and private value, the performance of universities and other post-secondary institutions should be evaluated to ensure that students are actually learning and not spending too much time playing beer pong and flip cup. (Although some is certainly a key socially formative experience for young adults!)
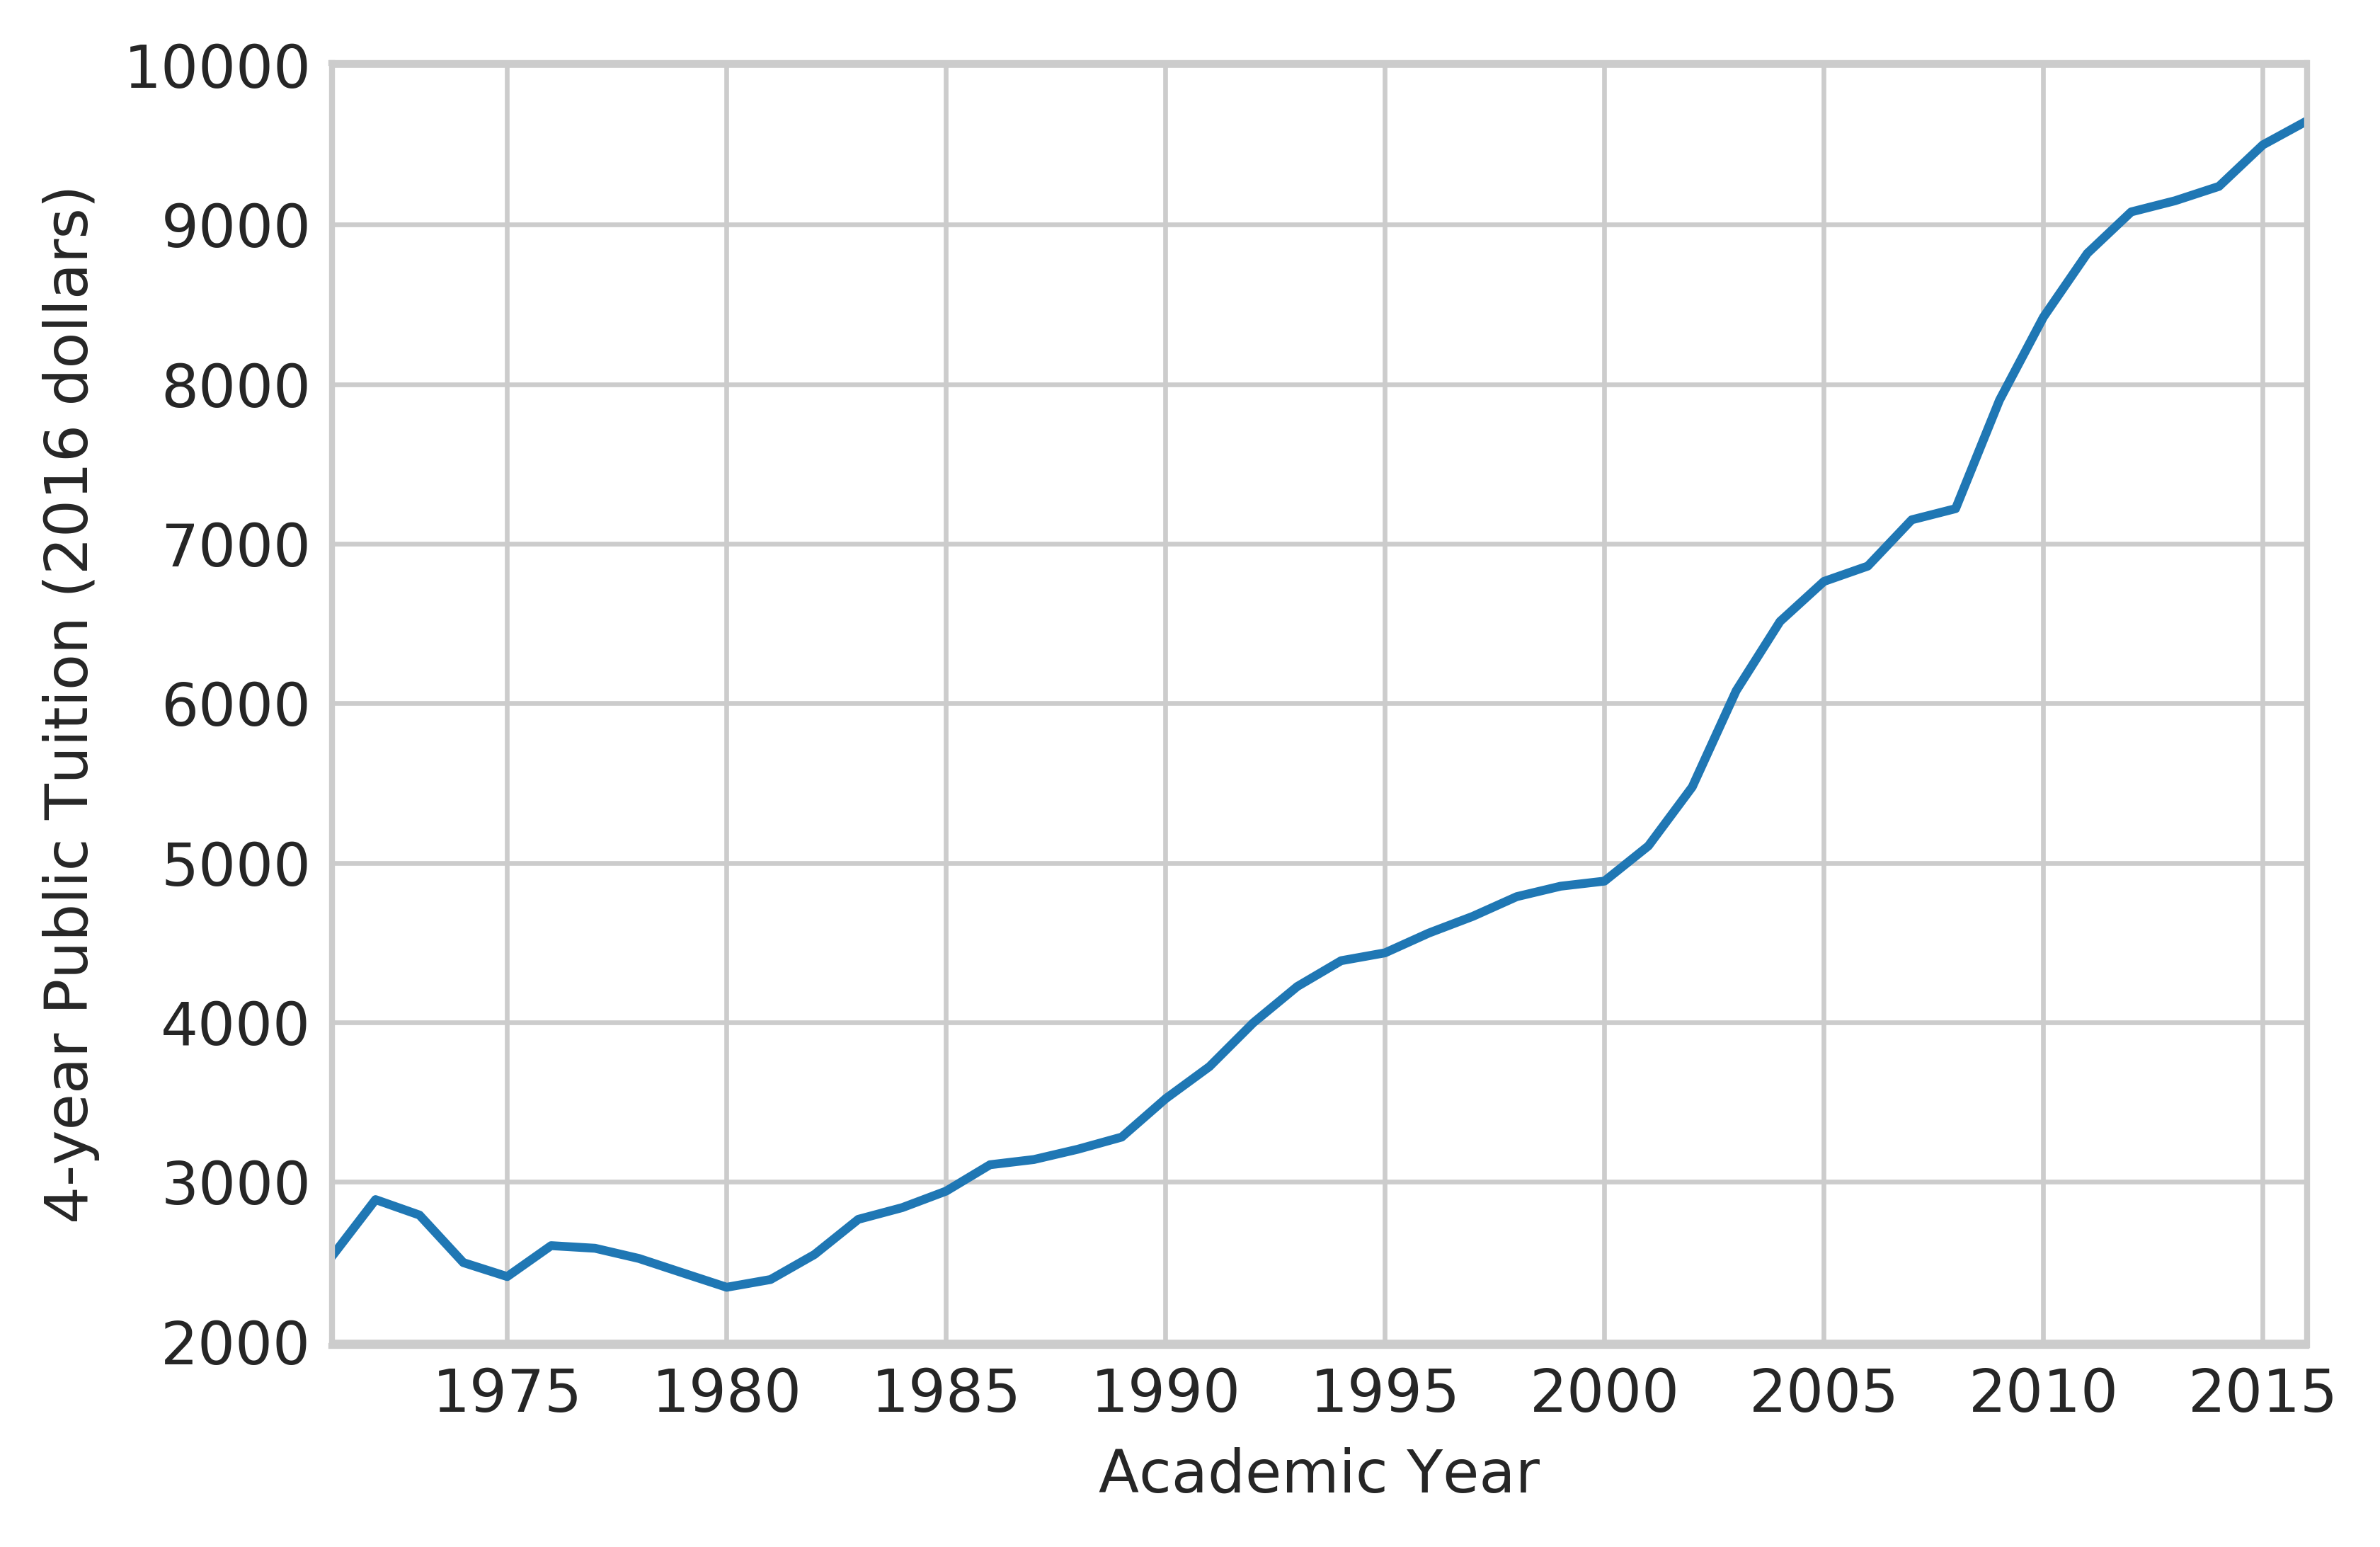
To exacerbate matters, tuition (after adjusting for inflation) has also increased precipitously in the last fifteen years or so see chart), often making the choice of college an agonizing one for all those involved.
 To help give prospective students (and their parents) evaluate colleges before they apply and enroll, the Department of Education releases a College Scorecard that provides a quick summary of the performance and cost of different colleges. Here is an example of this report for the colleges near my zipcode.
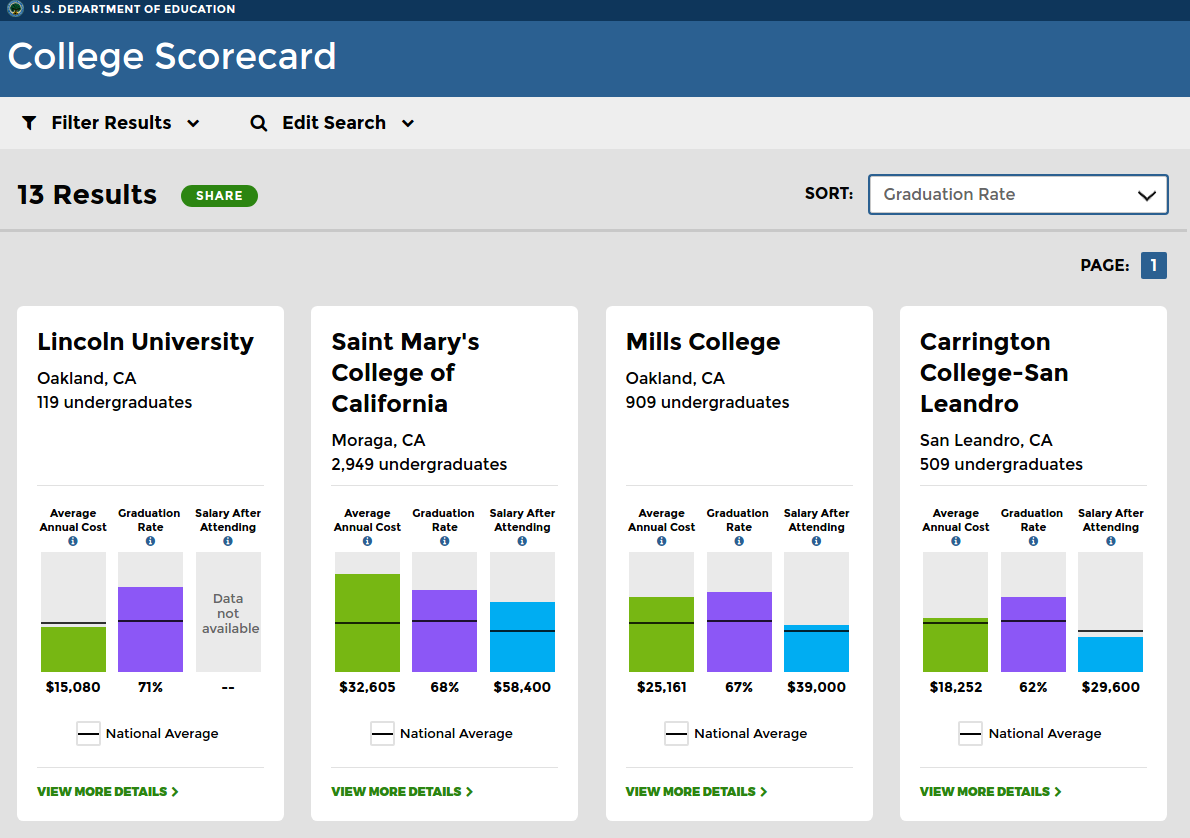 The data for average annual cost, graduate rate, and salary after attending is shown, but the Department of Education collects an enormous body of statistics on each college. These statistics can be accessed via download or a free API (application protocol interface) over a number of years. The data here is limited to 4-year universities, 2-year community colleges, and technical schools.
One particularly interesting statistic that the Department of Education collects is whether a college has closed or lost its accreditation in 2017 (encoded in the same statistic). If a college closes, students lose a lot of time and money since they have to apply to a new school. This new school may not accept transfer credits or be in a different location. A loss of accreditation is less severe, but the reputation loss may harm a student’s prospects afterwards.
Given this, I thought it would be interesting to try to predict whether a school would close or lose its accreditation by 2017 from the Department of Education statistics from 2013. During this time, there were a lot of high-profile school closures (particularly for for-profit private schools) because of their shady practices. Essentially, these schools would heavily market their educational programs as career-changing, take student loan money (subsidized by the government!), and then provide a subpar, nearly worthless education. One of these schools turned out to be particularly important to this problem, but I’ll save that as a surprise for later.
Data Collection and Cleaning
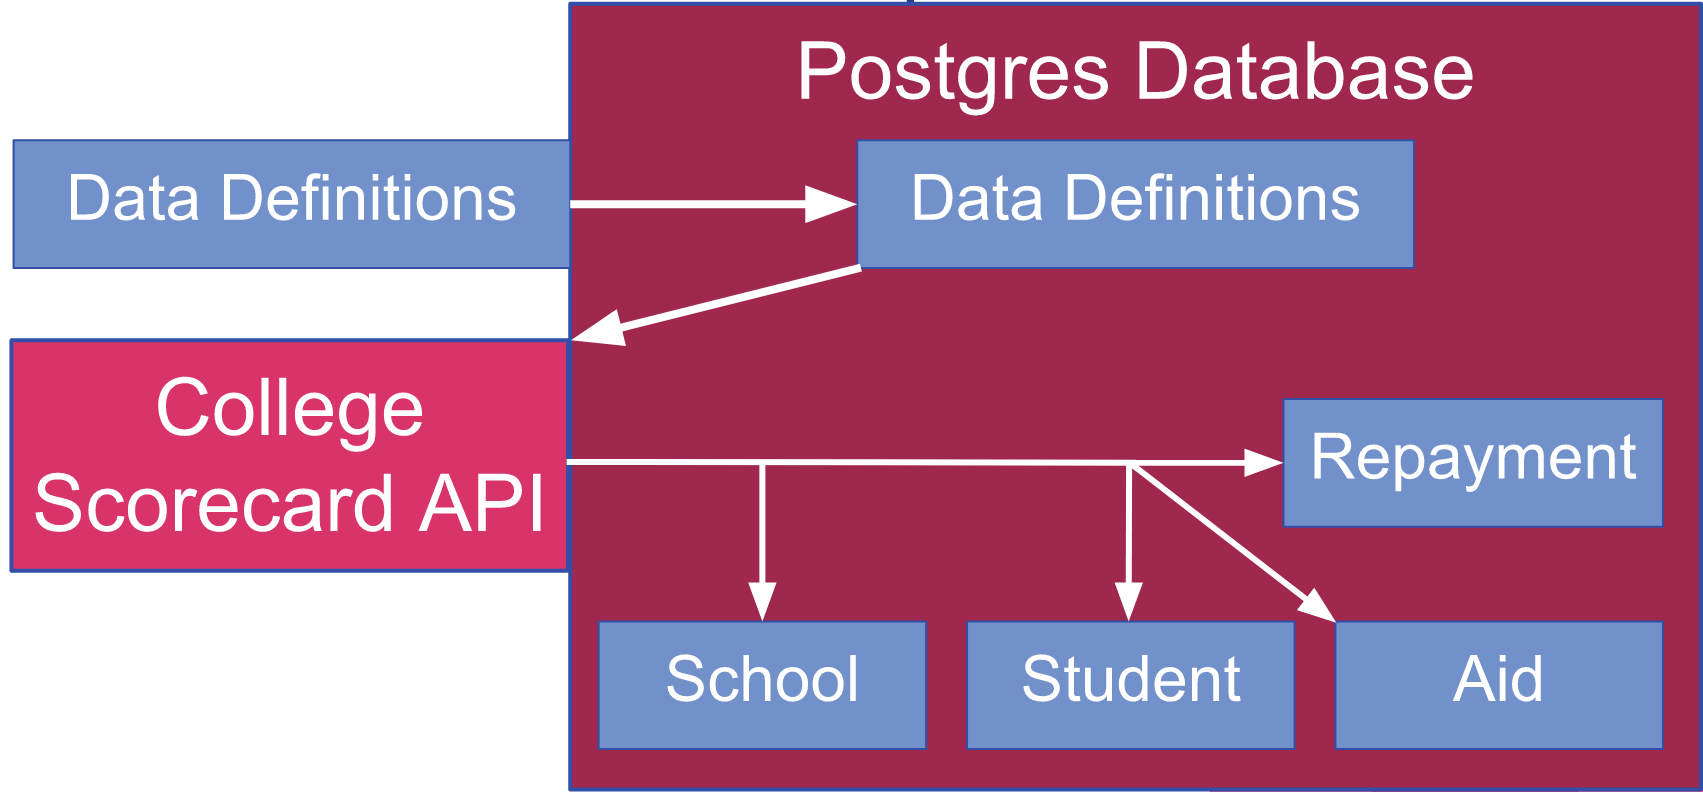
To obtain the data, I first downloaded the data definitions table from the Department of Education and stored it in a table in a Postgres SQL database. This table contains the API key for each variable so that it can be queried for information about each school. I then collected data for several different categories for each school. The school table included generic information about the school (e.g., private or public, etc.) along with whether it closed or lost its accreditation by 2017 or not. The other tables (student, aid, and repayment) included data from 2013 on the student demographics, types of federal aid received, and student loan default rates. In particular, I thought the latter two might be indicative of some of the shady practices of the for-profit schools I mentioned earlier.
After placing all the data into a Postgres database, I then used several JOIN statements to merge the data from each table into one data set based on school ID. I ended up with 7200 schools described by 43 numerical and categorical features. In the process, there was a missing data (as usual) for several of the features. For numerical data, I imputed the missing data with the mean. I was worried this might cause a leakage problem if the "closed" schools had missing data more often, however. I found that 7.2% and 9.7% of the data was missing for open and closed colleges, respectively. Therefore, there is a slight leakage problem with this data, and the model predictions are probably better than they would be otherwise.
Model Building
Once the data was obtained form the SQL database and cleaned, I then applied several different classification algorithms to predict the school's closure by 2017, including logistic regression (with l1 and l2 regularization), K-nearest neighbors, a single decision tree, Random Forest, and Gradient Boosted Trees classifiers. Of these, Random Forest performed the best of the various classifiers with an AUC score for the receiver operating characteristic curve of 0.90. In this case, since I was interested in prediction and not explanation (in contrast to the previous project), RandomForest's increased performance was worth the increase in model complexity.
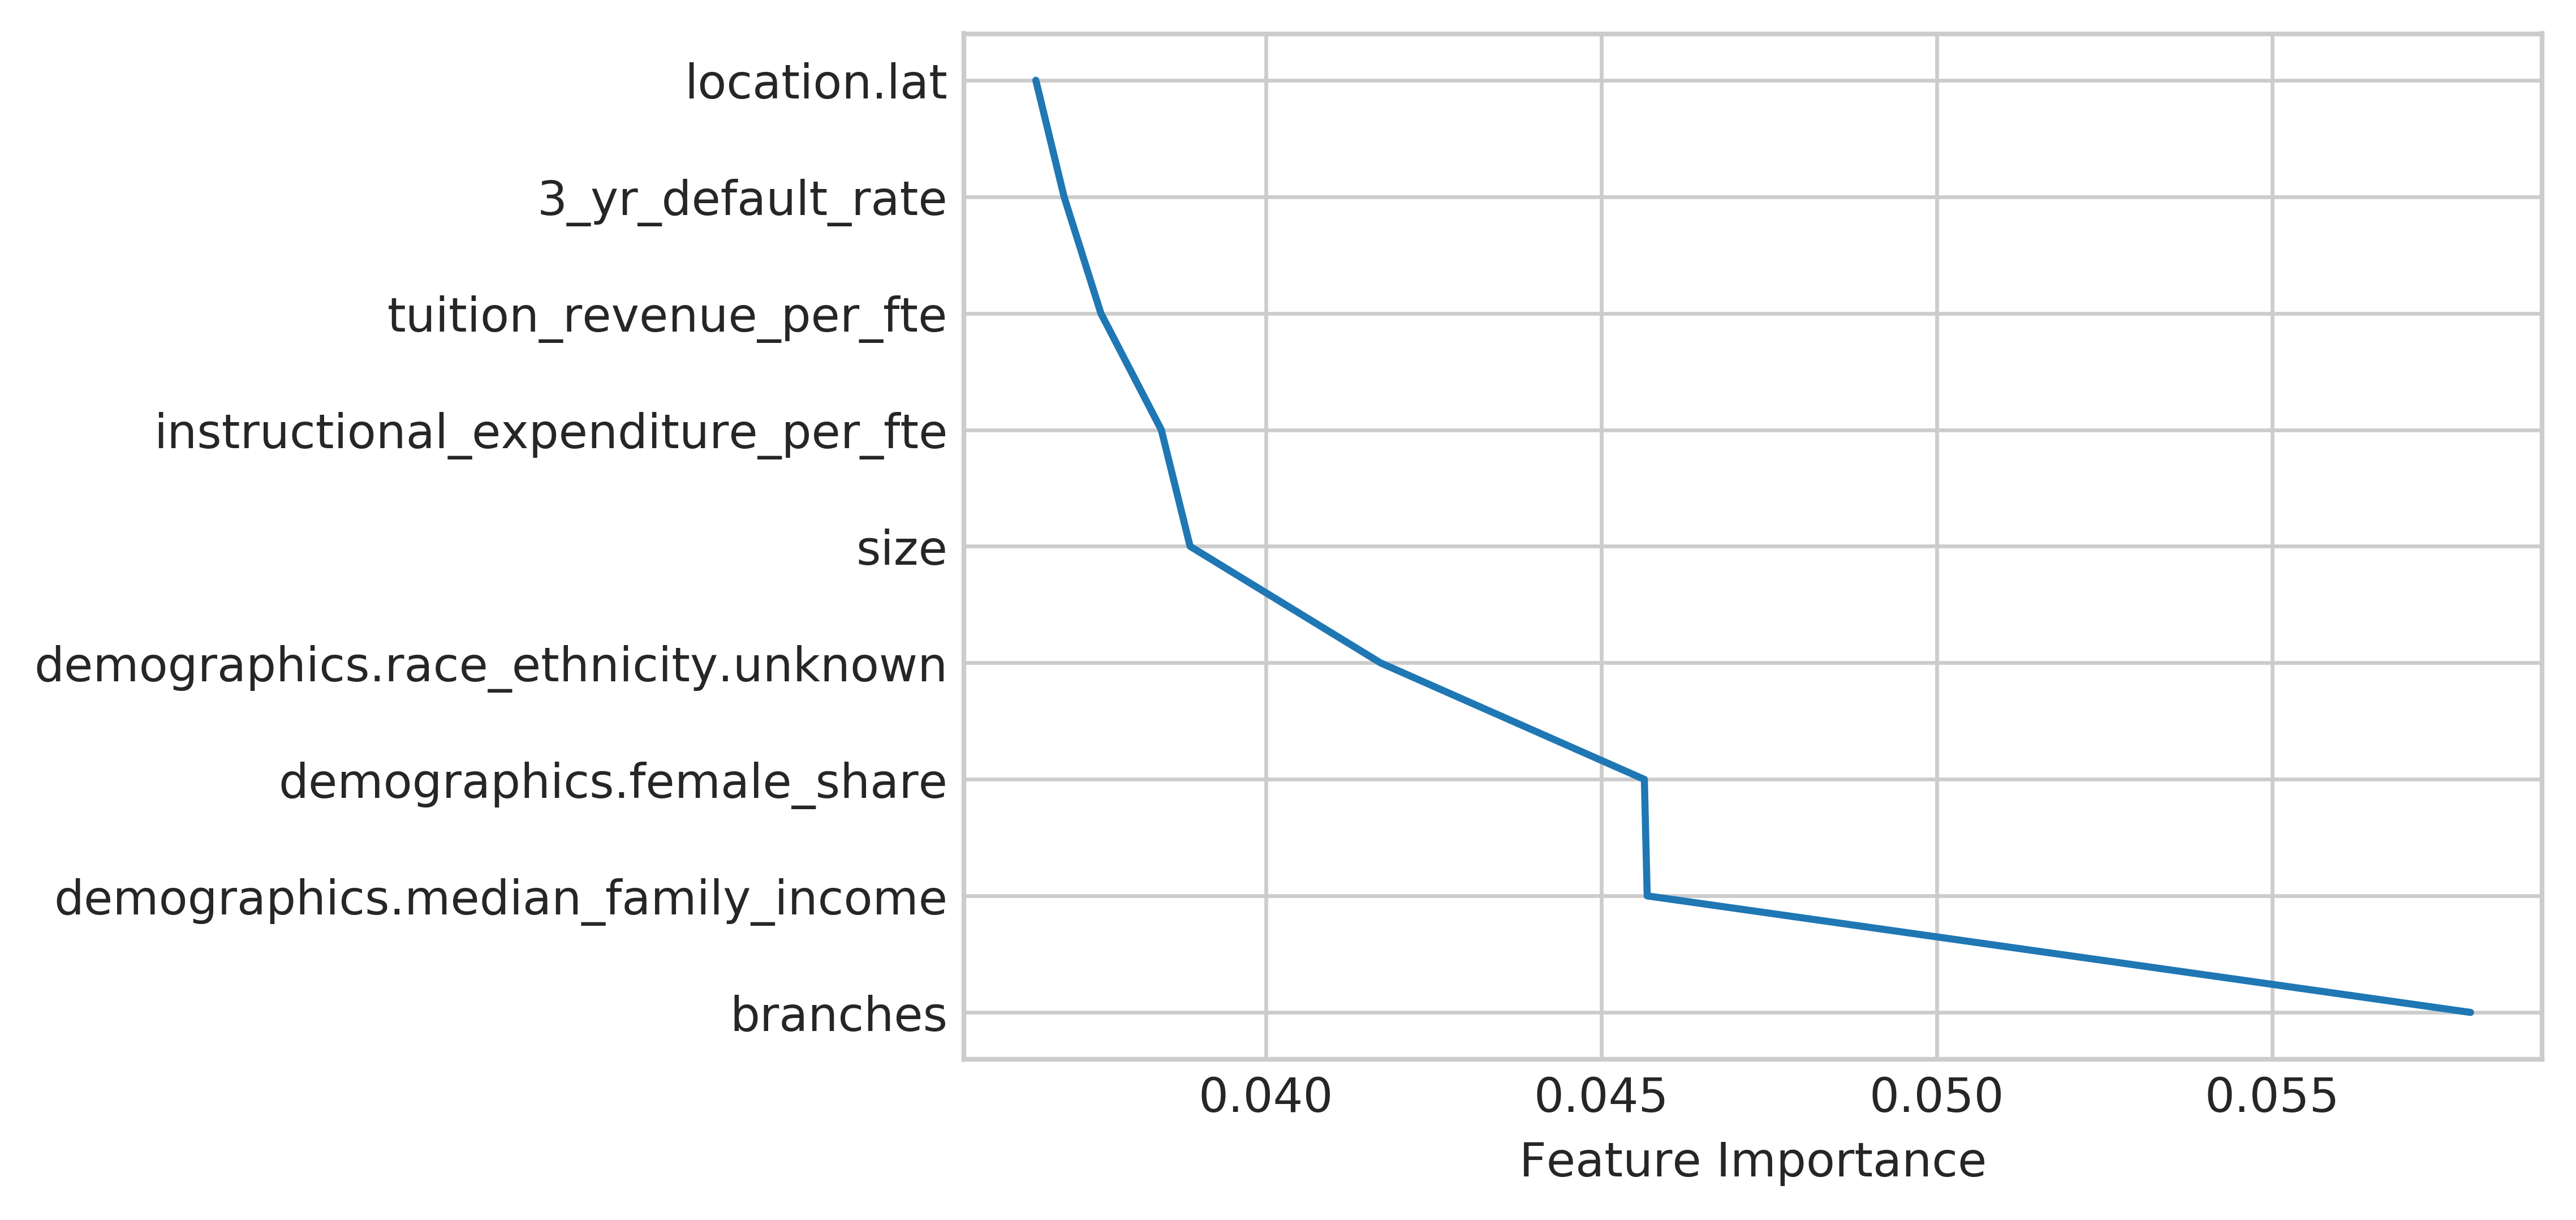
Interestingly, however, when I examined the feature importances of the random forest, I noticed that the model really picked up on the number of branches as a very important feature for more than 12% of the splits as shown below:
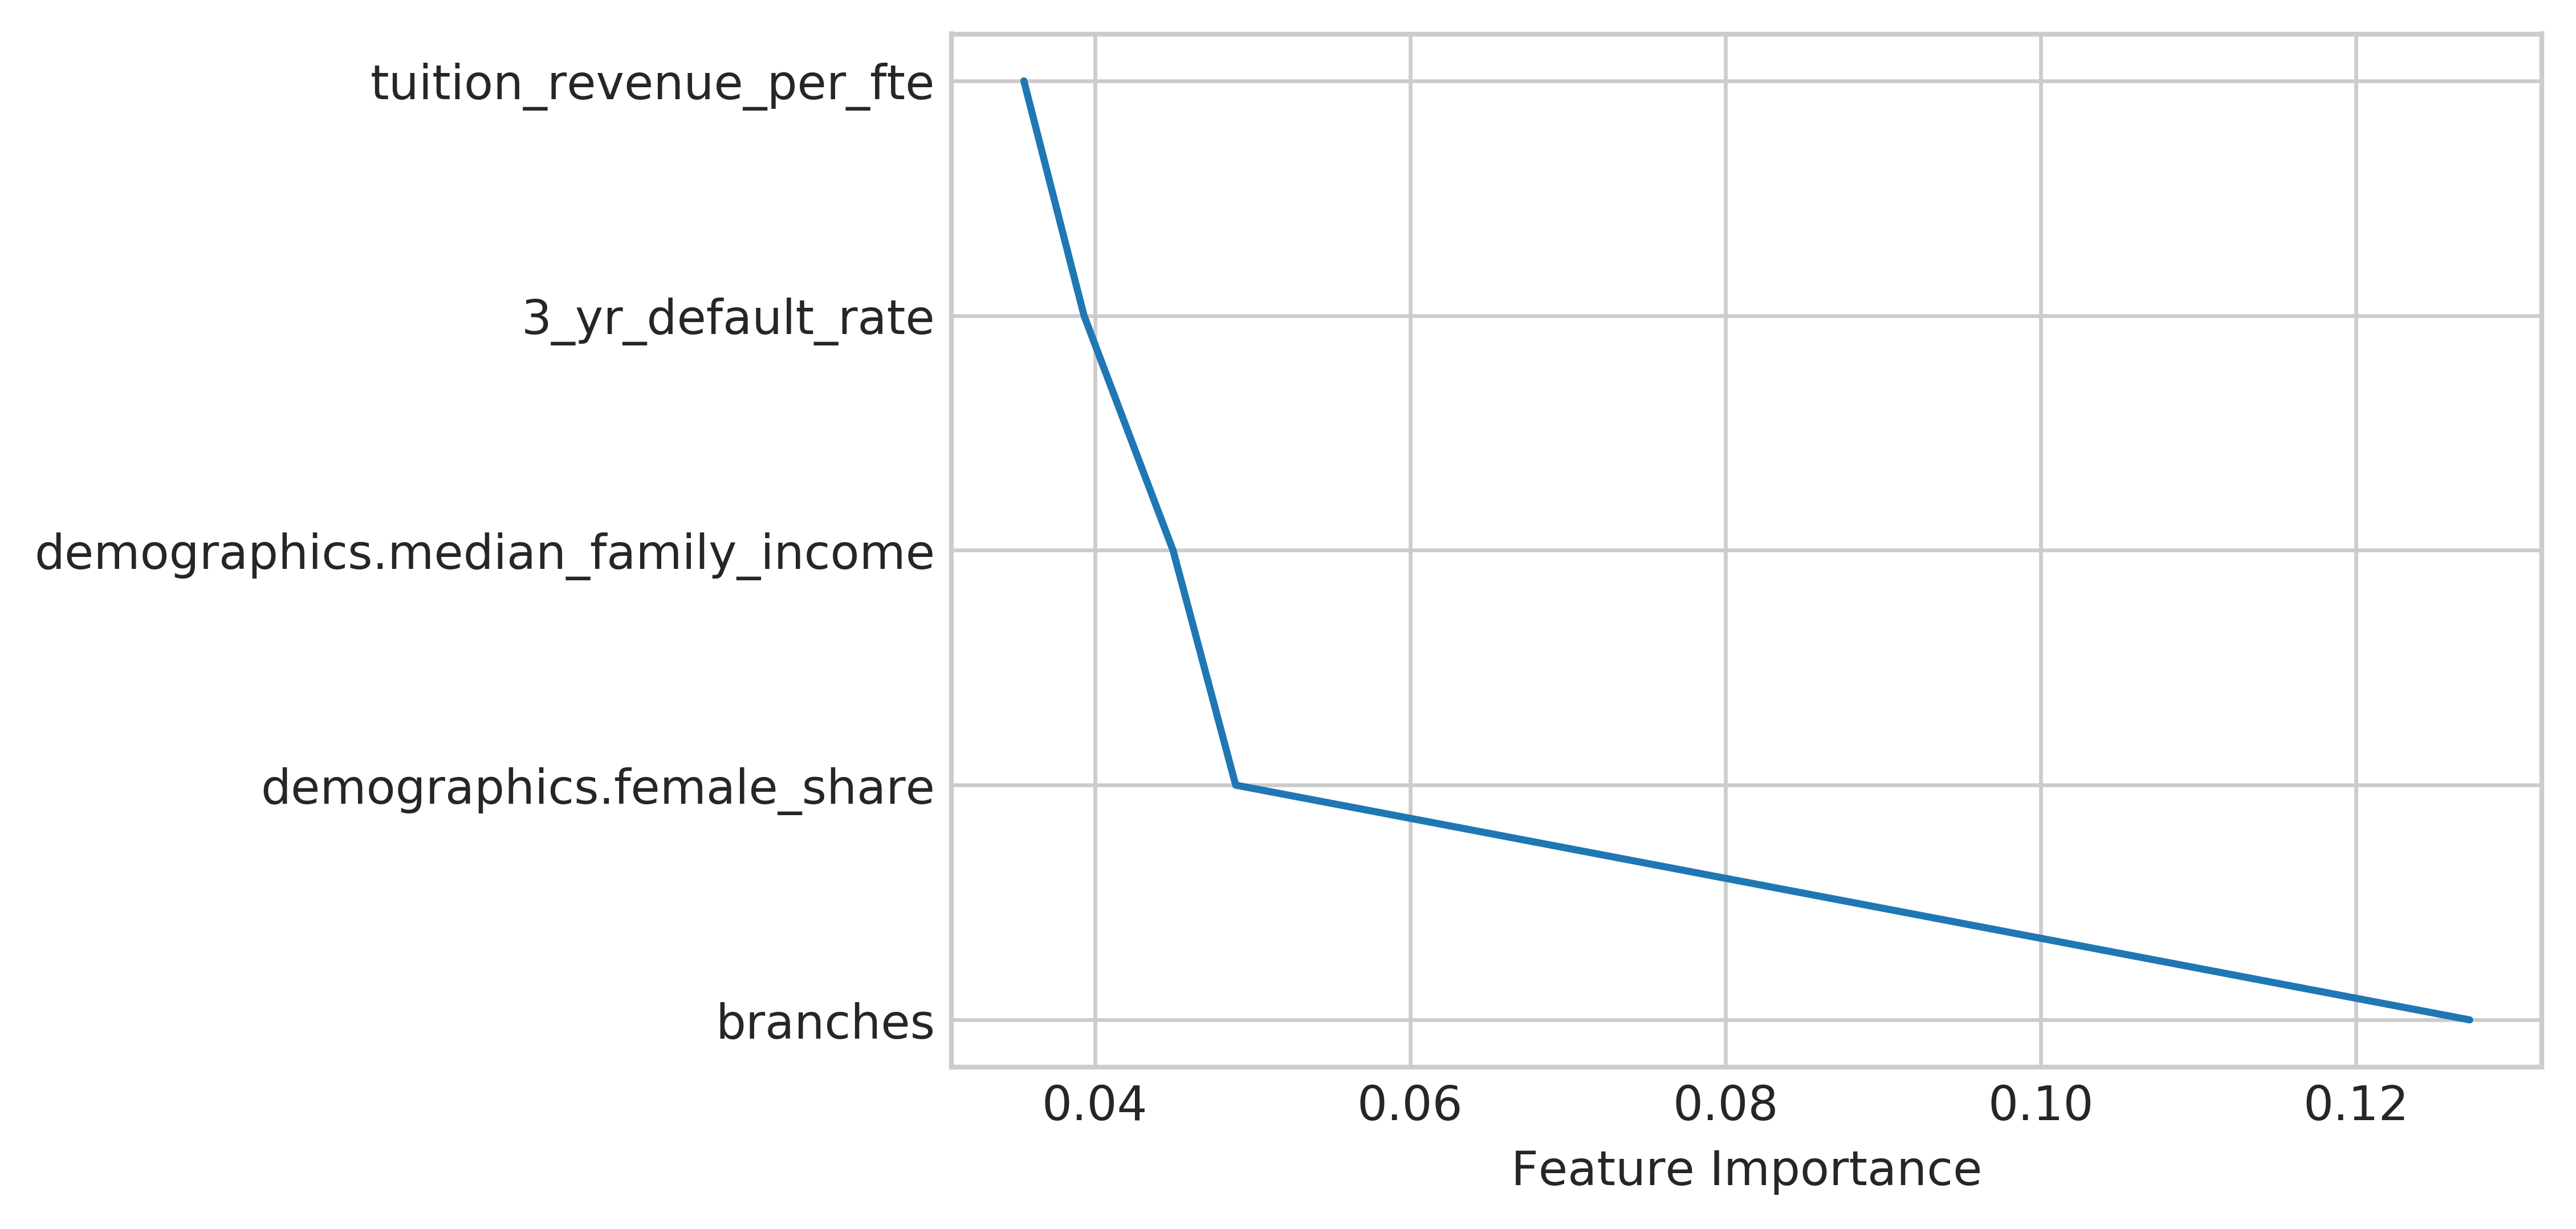
Examining this further, I found that the school in the dataset with the most number of branches was ITT Tech, which had 137 branches. ITT Tech was one very high profile college closure back in 2016, where all of the campuses closed down at once after state and federal officials filed lawsuits due to their fraudulant and predatory practices. Each of these branches is included as a separate entry in the data, so ITT Tech is somewhat overrepresented in the 900 schools that closed from 2013 to 2017.
To ensure that the model was not just picking up on the characteristics of ITT Tech, I ran the Random Forest model again after removing ITT Tech from the data. Thankfully, the AUC score only declined to 0.89, suggesting that the model was not only picking up on ITT Tech. The feature importance of branches also declined to only 5% of the splits, although it still was the most important feature that the RandomForest made decisions based on.
Model Evaluation
To evaluate the model, I plotted the ROC curve and precision recall curve for the Random Forest model without ITT Tech in the data.
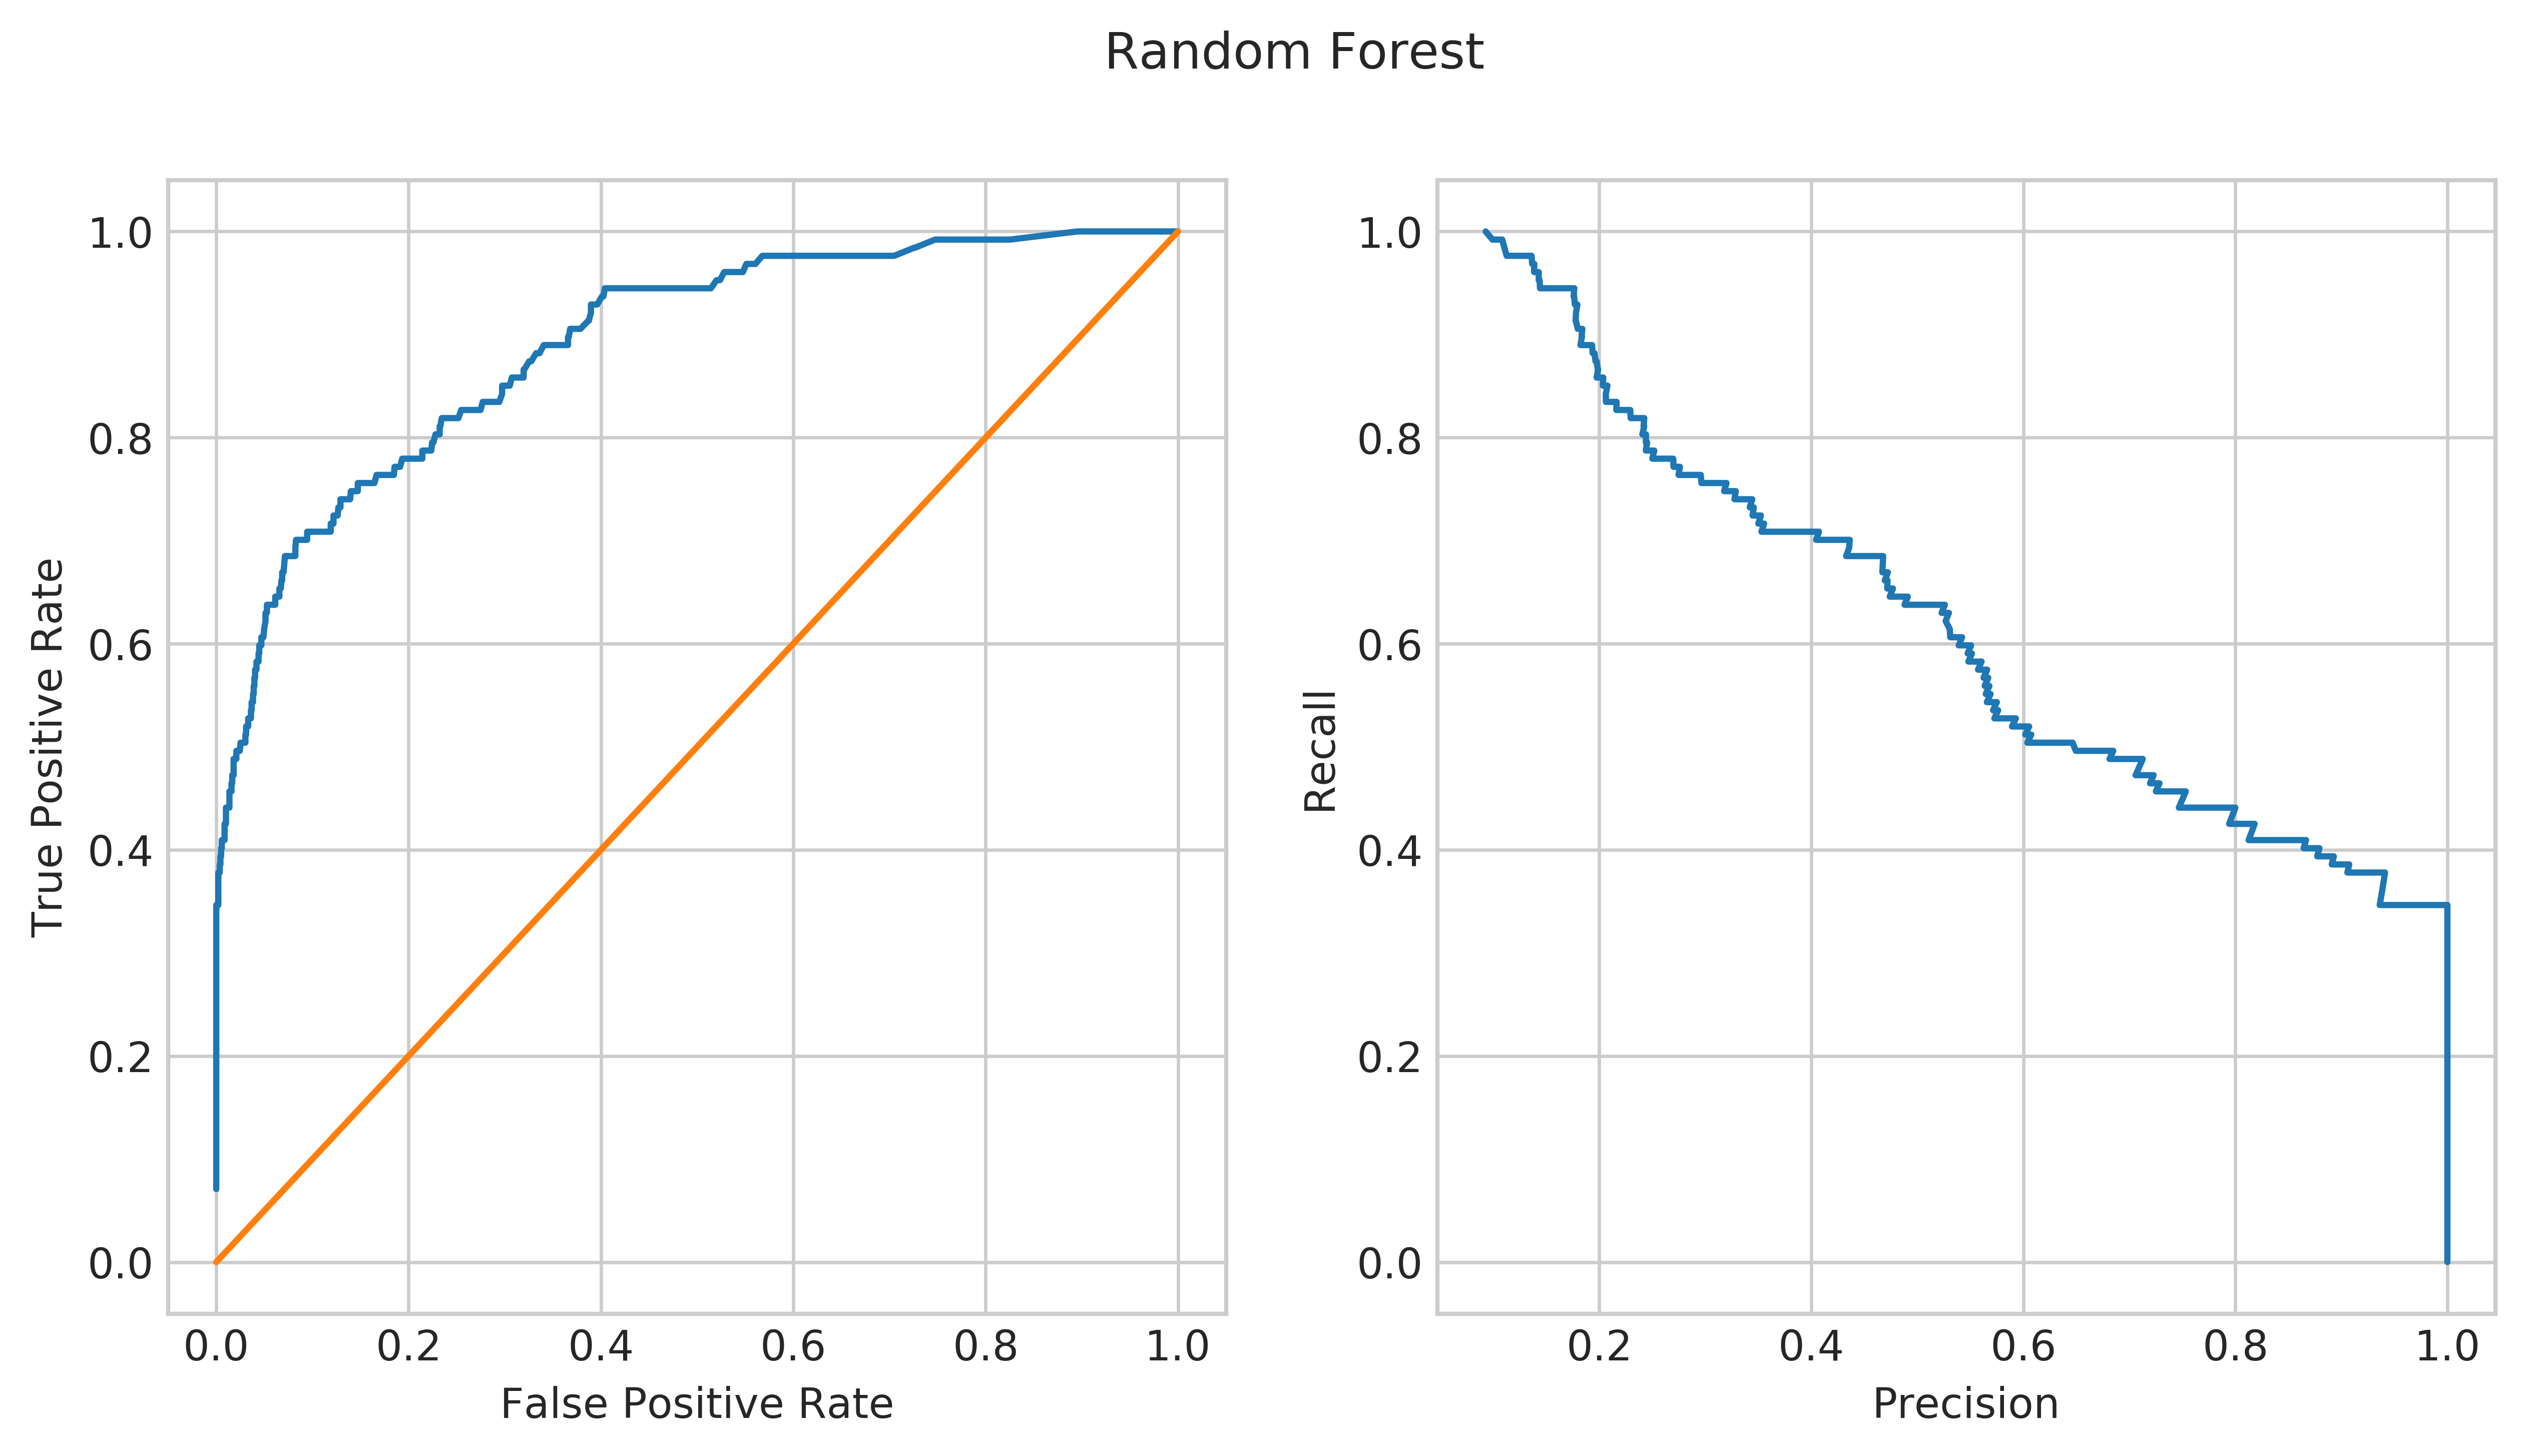
Here, the receiver operating characteristic plot on the left compares the true positive rate (correctly predicting that a college closed) to the false positive rate (incorrectly predicting that a college closed) as the threshold for predicting closure increases. Essentially, the more we try to predict college closures, the more we will make false predictions of closure. In addition, if our model is just guessing, we will fall along the diagonal orange line in the center. Similarly, the plot on the right is the the Precision-Recall curve. Here, we compare recall (the true positive rate) to the precision (how many of our predicted positives are actually positive) as our threshold for closure increases. Again, there is a trade-off between the two where the more positive values you correctly predict, the more times you incorrectly predict negatives as positives. In both these cases, the model performs fairly well in both curves.
If that was confusing (and it is to lots of people, so don't worry!), a metaphor may help explain the trade-off inherent in classification problems like this. Consider two different dog breeds as guard dogs: a yorkshire terrier and a labrador. The yorkshire terrier is very protective of their territory and will bark at almost anything, including a leaf landing on the ground (trust me, I live with one.) Because of this behavior, the dog will bark at everything, whether it's really a threat or not (like a burglar.) In this case, the yorkshire terrier has a high true positive rate/recall (it barks at everything, including burglars) but a low precision (almost everything it barks at is not a threat.) In contrast, a labrador is a very friendly dog, playing fetch with whoever. The dog probably will not bark at a stranger, unless they really perceive that something is wrong. Therefore, the labrador has a low true positive rate/recall (it is likely to miss that burglar sneaking in) but a high precision (if it gets aggressive, there must be something really wrong.)
 High recall-low precision dog.
Closure Risk Assessment
Given that this was a backward-looking model, the results are probably not all that useful to the students like those at ITT Tech that saw their school close. To make these results more useful, I looked at the probability predicted by the random forest model (without ITT Tech) for the schools that remained open. Because these probabilities are not properly calibrated, I divided these into arbitrary "low risk", "medium risk", and "high risk" categories as shown below:
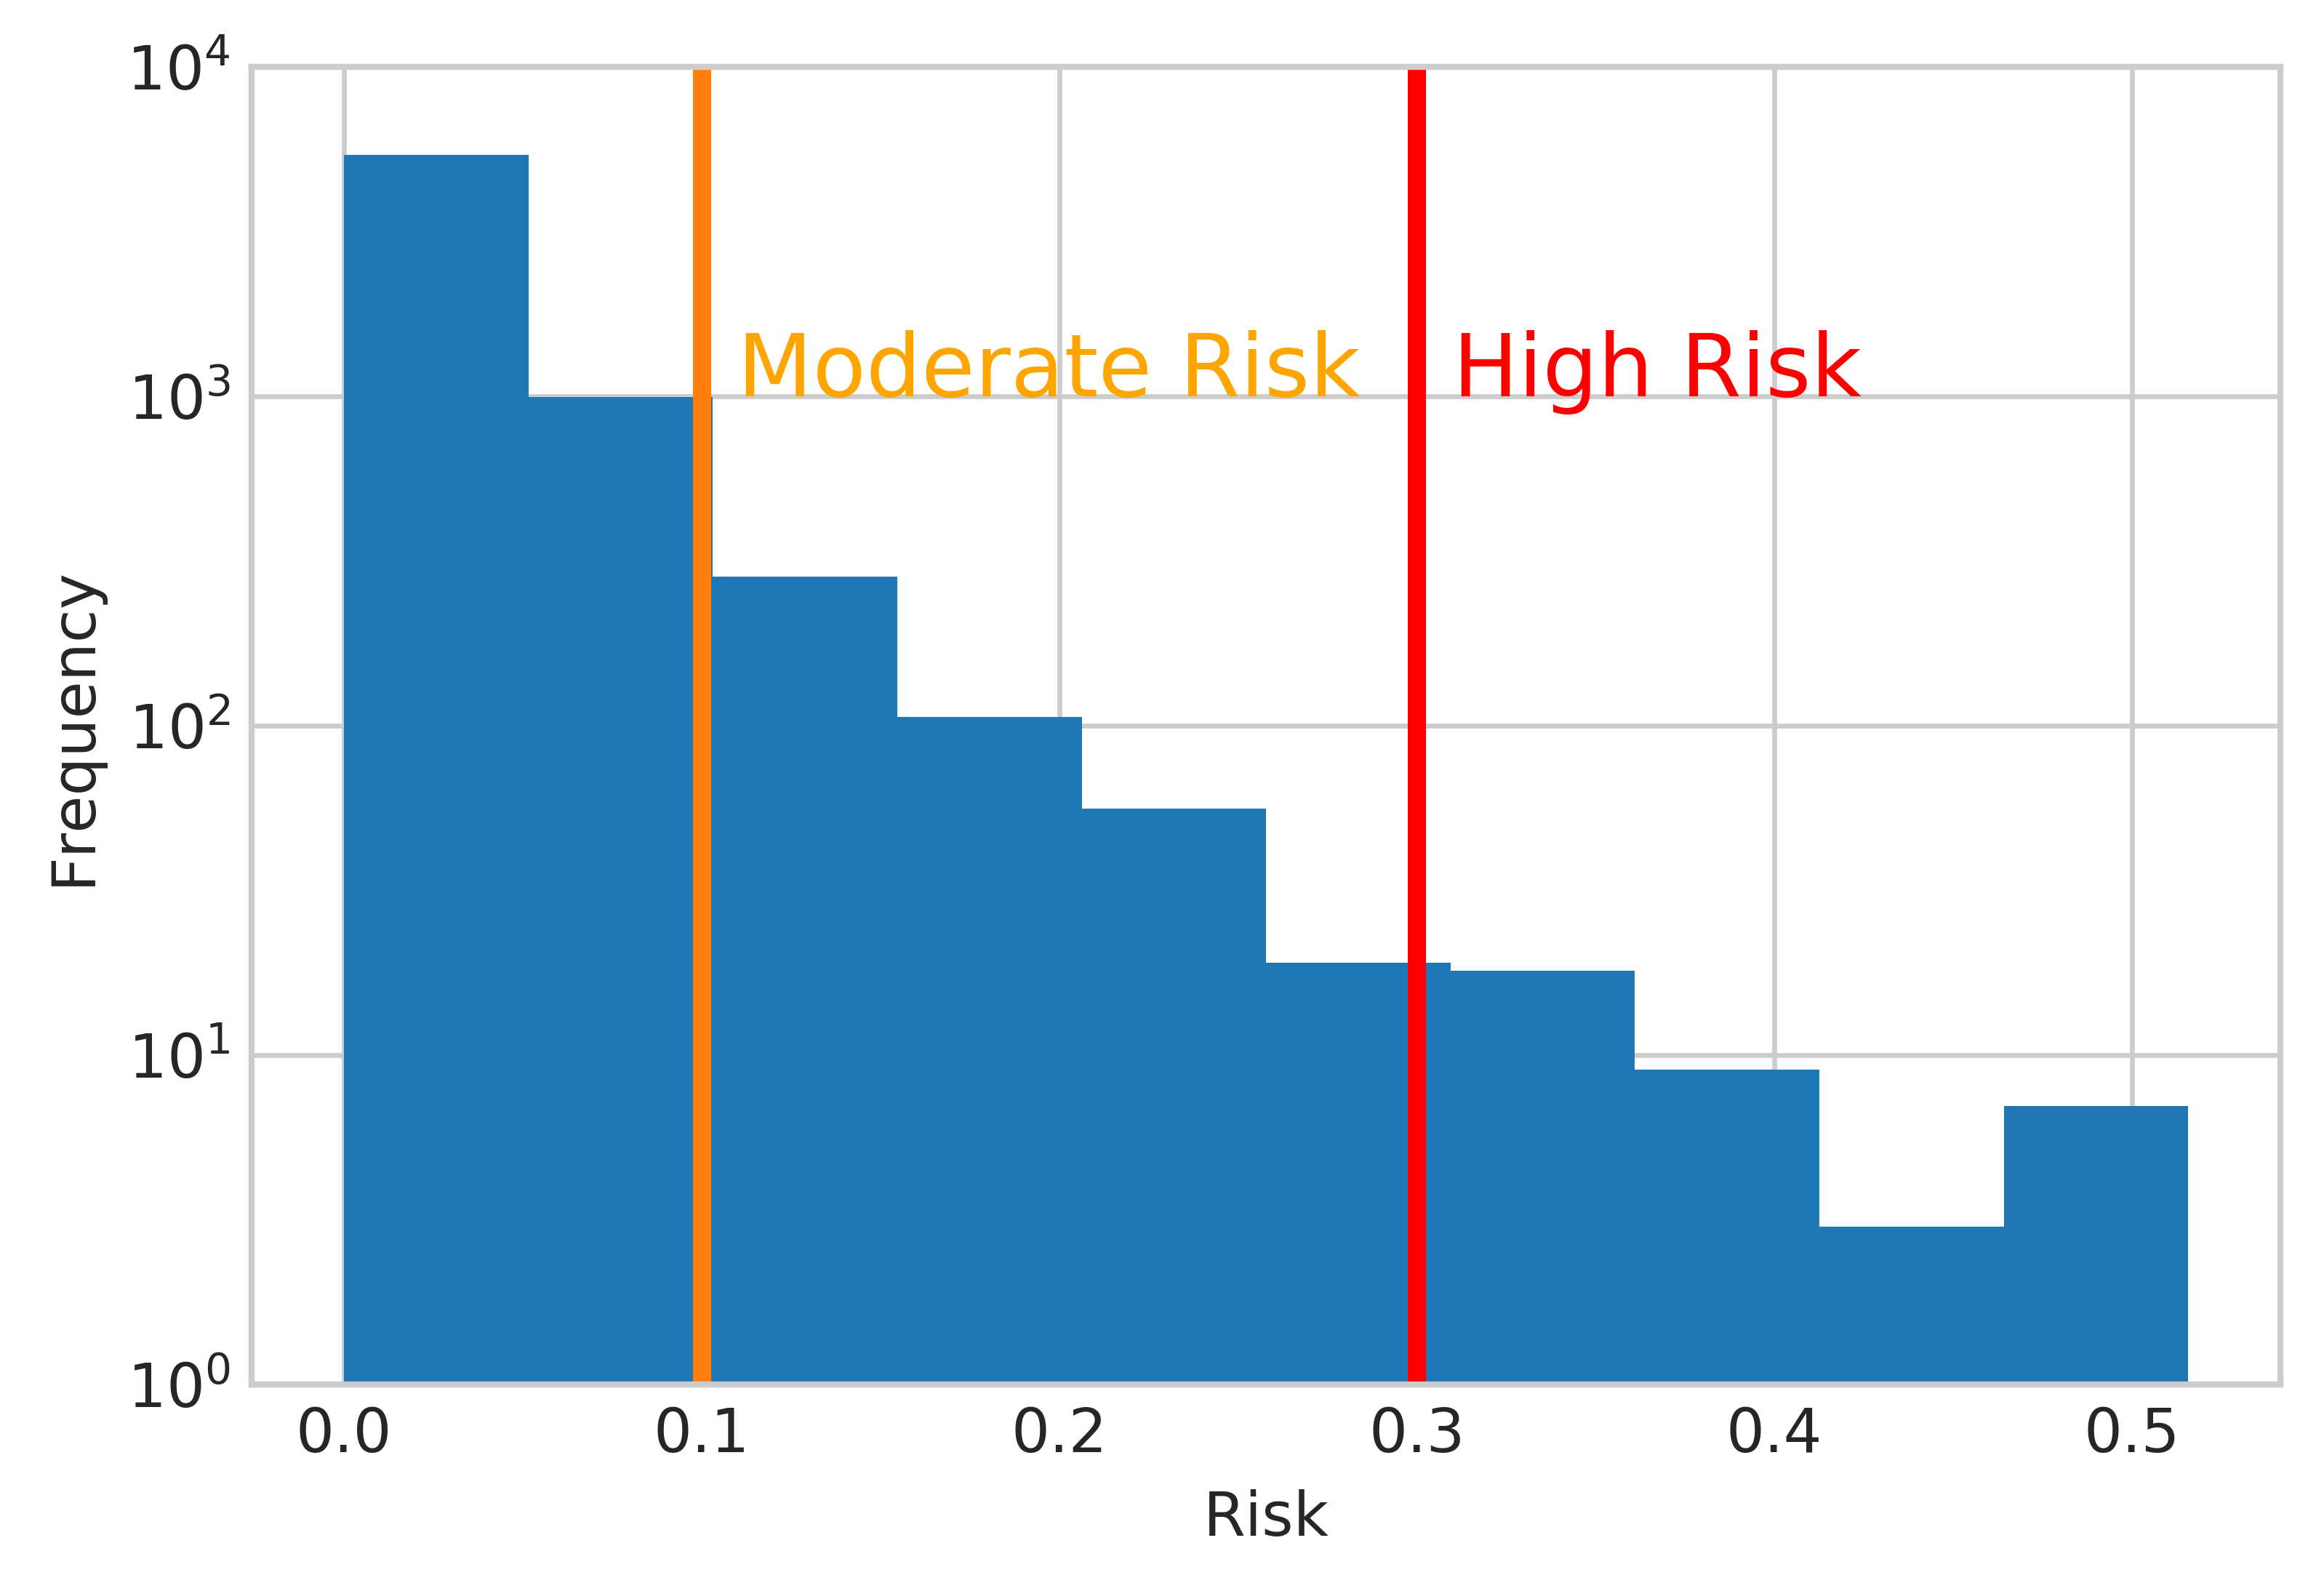
I then found which schools were medium or high risk and plotted them using an interactive map in d3.js here. The orange dots are medium risk and the red dots are high risk. Of the schools shown, it seems like a lot of beauty or barber colleges are at risk of closing. Let me know if you find any other patterns!
The code for this project can be found here.