Summary
Given my interest in home brewing and craft beer, I wanted to analyze the preferences of craft beer geeks, with the hope of using this information to help advise new breweries on which beers to include in their initial tap list. These consumers are novelty-seeking and will spread word of a brewery they like to friends or online, so winning over these consumers early is the key to success.
To help obtain this information, I web crawled BeerAdvocate, a webisite where craft beer geeks can rate various commercial craft beer. Using these ratings, I wanted to understand which characteristics of the beer were particularly important in determining beer geeks' preferences for craft beer. After a particular beer receives 10 ratings, the website aggregates the users' ratings of the appearance, mouthfeel, smell, and taste to produce a BeerAdvocate score from 0 to 100. In addition, the website also contains information about the number of ratings, spread between each of the ratings (in other words, how polarizing the beer is), alcohol by volume (ABV), and style of the beer.
I obtained approximately 35,000 beers with valid BeerAdvocate scores. The distribution of scores is shown below:
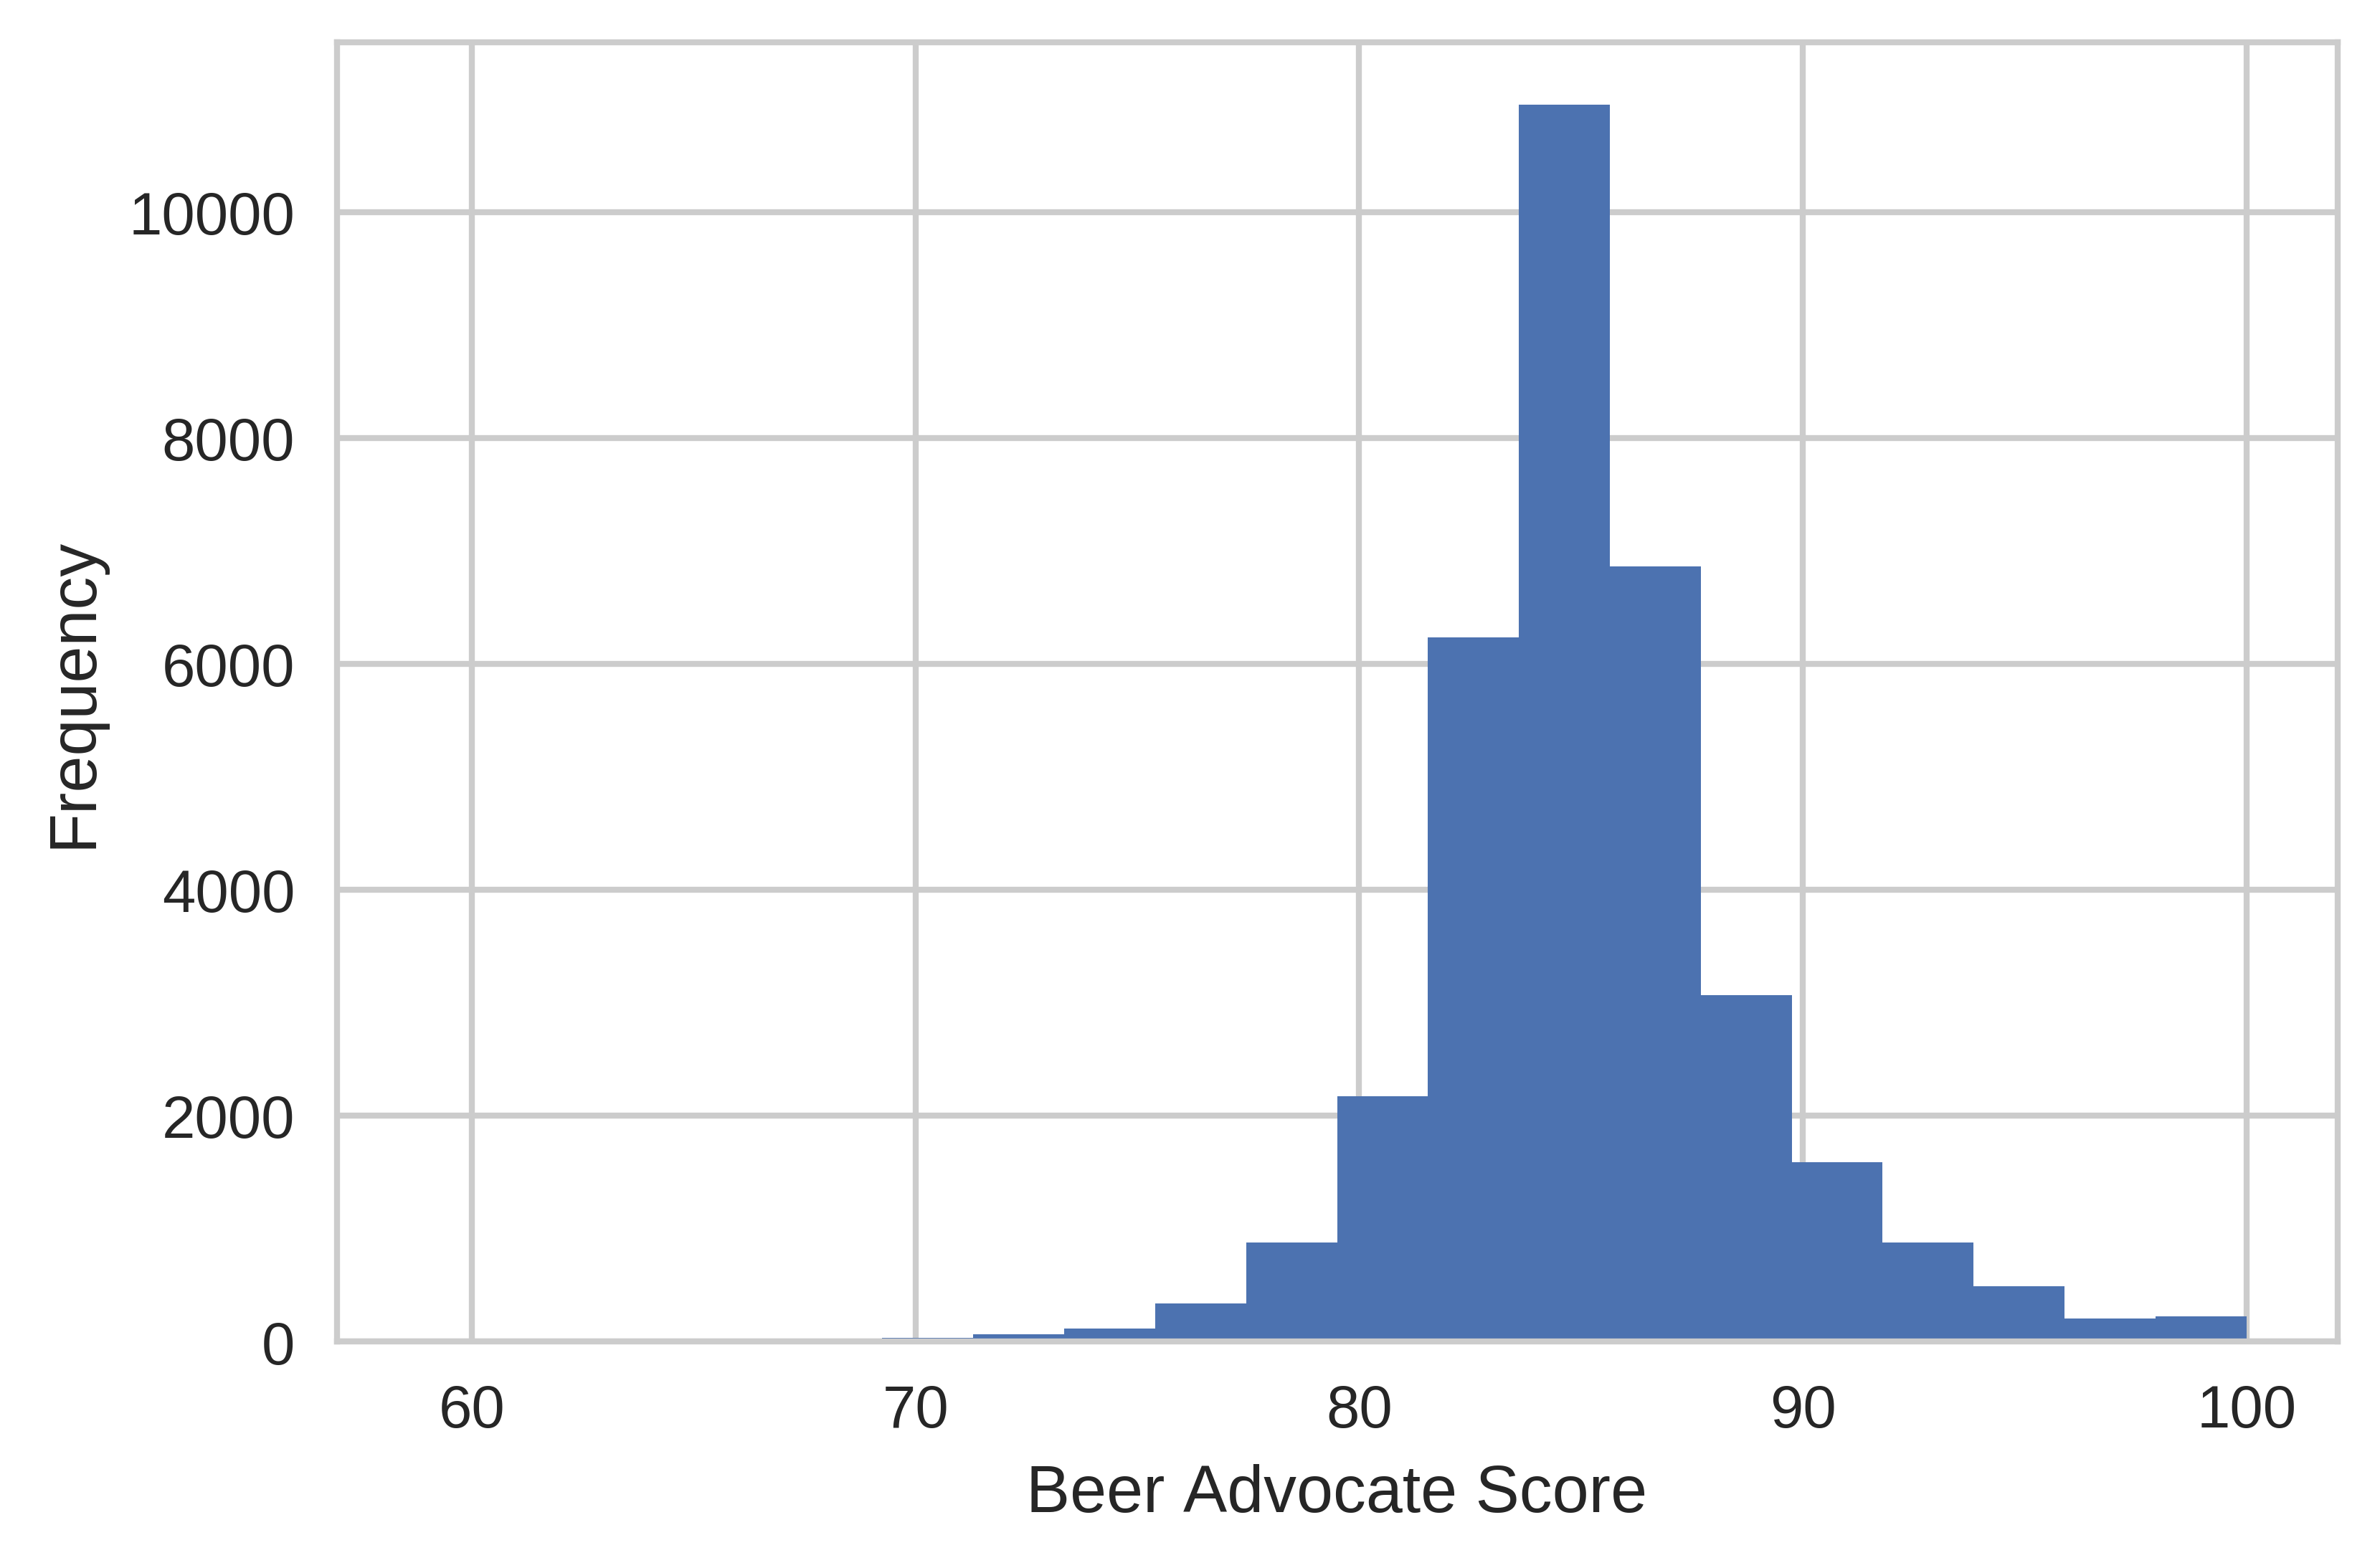
Most of the beers receive scores of about 85 with an approximately symmetric distribution. Few beers in this subset received ratings lower than 70, although this particular subset includes only ales, which tend to be more highly rated. Lagers (the kind of beer most non-beer geeks are familiar with) such as Budweiser are generally very poorly rated except for, "inexplicably", Pabst Blue Ribbon and Schlitz (Hipsters!!!! shakes fist). I did not include lagers for this project, although I did include them for a beer recommendation system I developed later.
Of the (less subjective) characteristics associated with each beer, the number of ratings and ABV were most strongly associated with a high score. In other words, people will tend to rate beers that are higher in alcohol or have a lot of ratings better. Given that, a new brewery would probably want to have an imperial/double IPA, imperial stout, or Belgian tripel/quad on tap. Just don't get in trouble with the Alcohol Control Board! Ratings also seemed to play a key role, so I interpreted this to mean that beers that are widely known and/or hyped a lot will tend to get a better rating. A great example of this is Pliny the Elder, a double IPA from the Russian River Brewing Company, that has a BeerAdvocate score of 100 and is relentlessly hyped by creating artificial scarcity. (I've had it before; it's good, but not that good.) This may be difficult to accomplish for a smaller, starting brewery, and be careful not to lose the trust of your customers!
Some of the more minor characteristics that people tended to prefer were sour, hoppy, and German beers. The former two are not necessarily all that revealing to anyone who understands the current craft beer market. In addition, a sour beer might be a challenge for a new brewery, considering that a good sour beer often requires at least 3-4 months of aging compared to the typical 2 weeks for most ales. However, interestingly, a good, properly-made Hefeweissen (i.e., what you won't find at most American breweries) would be a good choice to add to your tap list in addition to the typical hoppy/sour fare.
Technical Details
In this section, I go over some of the more technical details of how the model was constructed. The code for this project is available via Github.
Feature Engineering
Once I had collected the data, I began building machine learning regression models to explain beer preferences. The initial models using the original features (variables) were not all that interesting because it came up with the brilliant insight that people like beers that taste and smell good (PBR and Schlitz not withstanding) with a high R2 score (>0.9). Given that taste and smell are also used to calculate the BeerAdvocate score, this was also circular reasoning, so I removed sensory data (taste, smell, mouthfeel, appearance) from the data.
In addition, much of the information about the beer that was embedded in the style variable was not used in the regression. As such, I created several categorical dummy variables based on typical characteristics for each style. First, I separated beers into country of origin variables for American, German, Belgian, and British beers. Then, I created an ordinal variable that represnted the approximate hue (yellow -> orange/amber -> dark) of the beer. I also created several dummy variables that represented whether the beer style was typically hoppy, made with a particular grain (wheat or rye), or sour.
Although this provided more information about the beer to the regression algorithm, this was only a crude approximation of the actual characteristics of the beer. In reality, the style of a beer is a very loose representation of the beer as brewers tend to call beers whatever they feel like. Furthermore, some styles of beer such as American IPA (India Pale Ale) are incredibly broad since the hops used could provide a citrusy, herbal, floral, or other aroma. (Lately, hop farmers in the Northwestern US have been experimenting a lot with breeding many types of new hops with different aromas or flavors from the typical noble German hops.)
Lasso Regression
Once I produced additional features for each beer, I ran several different kinds of regression models. Although it did not necessarily produce the best R2 score, I ended up going with Lasso regression because I was more interested in explanation, so a simpler, easy to interpret model like Lasso is more appropriate than, for example, Gradient Boosted Trees regression. Something like Boosted Trees is best for predictions, where we just care about predicting a value rather than explaining it.
In any case, Lasso is a method of linear regression that helps prevent the model from overfitting (that is, only making good predictions on the original data and not any new data) . It accomplishes this by penalizing model coefficients for getting too large. Lasso can actually set certain coefficients to zero, which can be a handy way to reduce the number of variables your model uses. Because of this property, lasso is often used for feature selection via regularization in other types of more complex models unrelated to simple regression models.
Graphing the coefficients (including the sensory information) can give us an idea of which characteristics best predicted the beer's rating and which characteristics did not matter (that is, were zero).
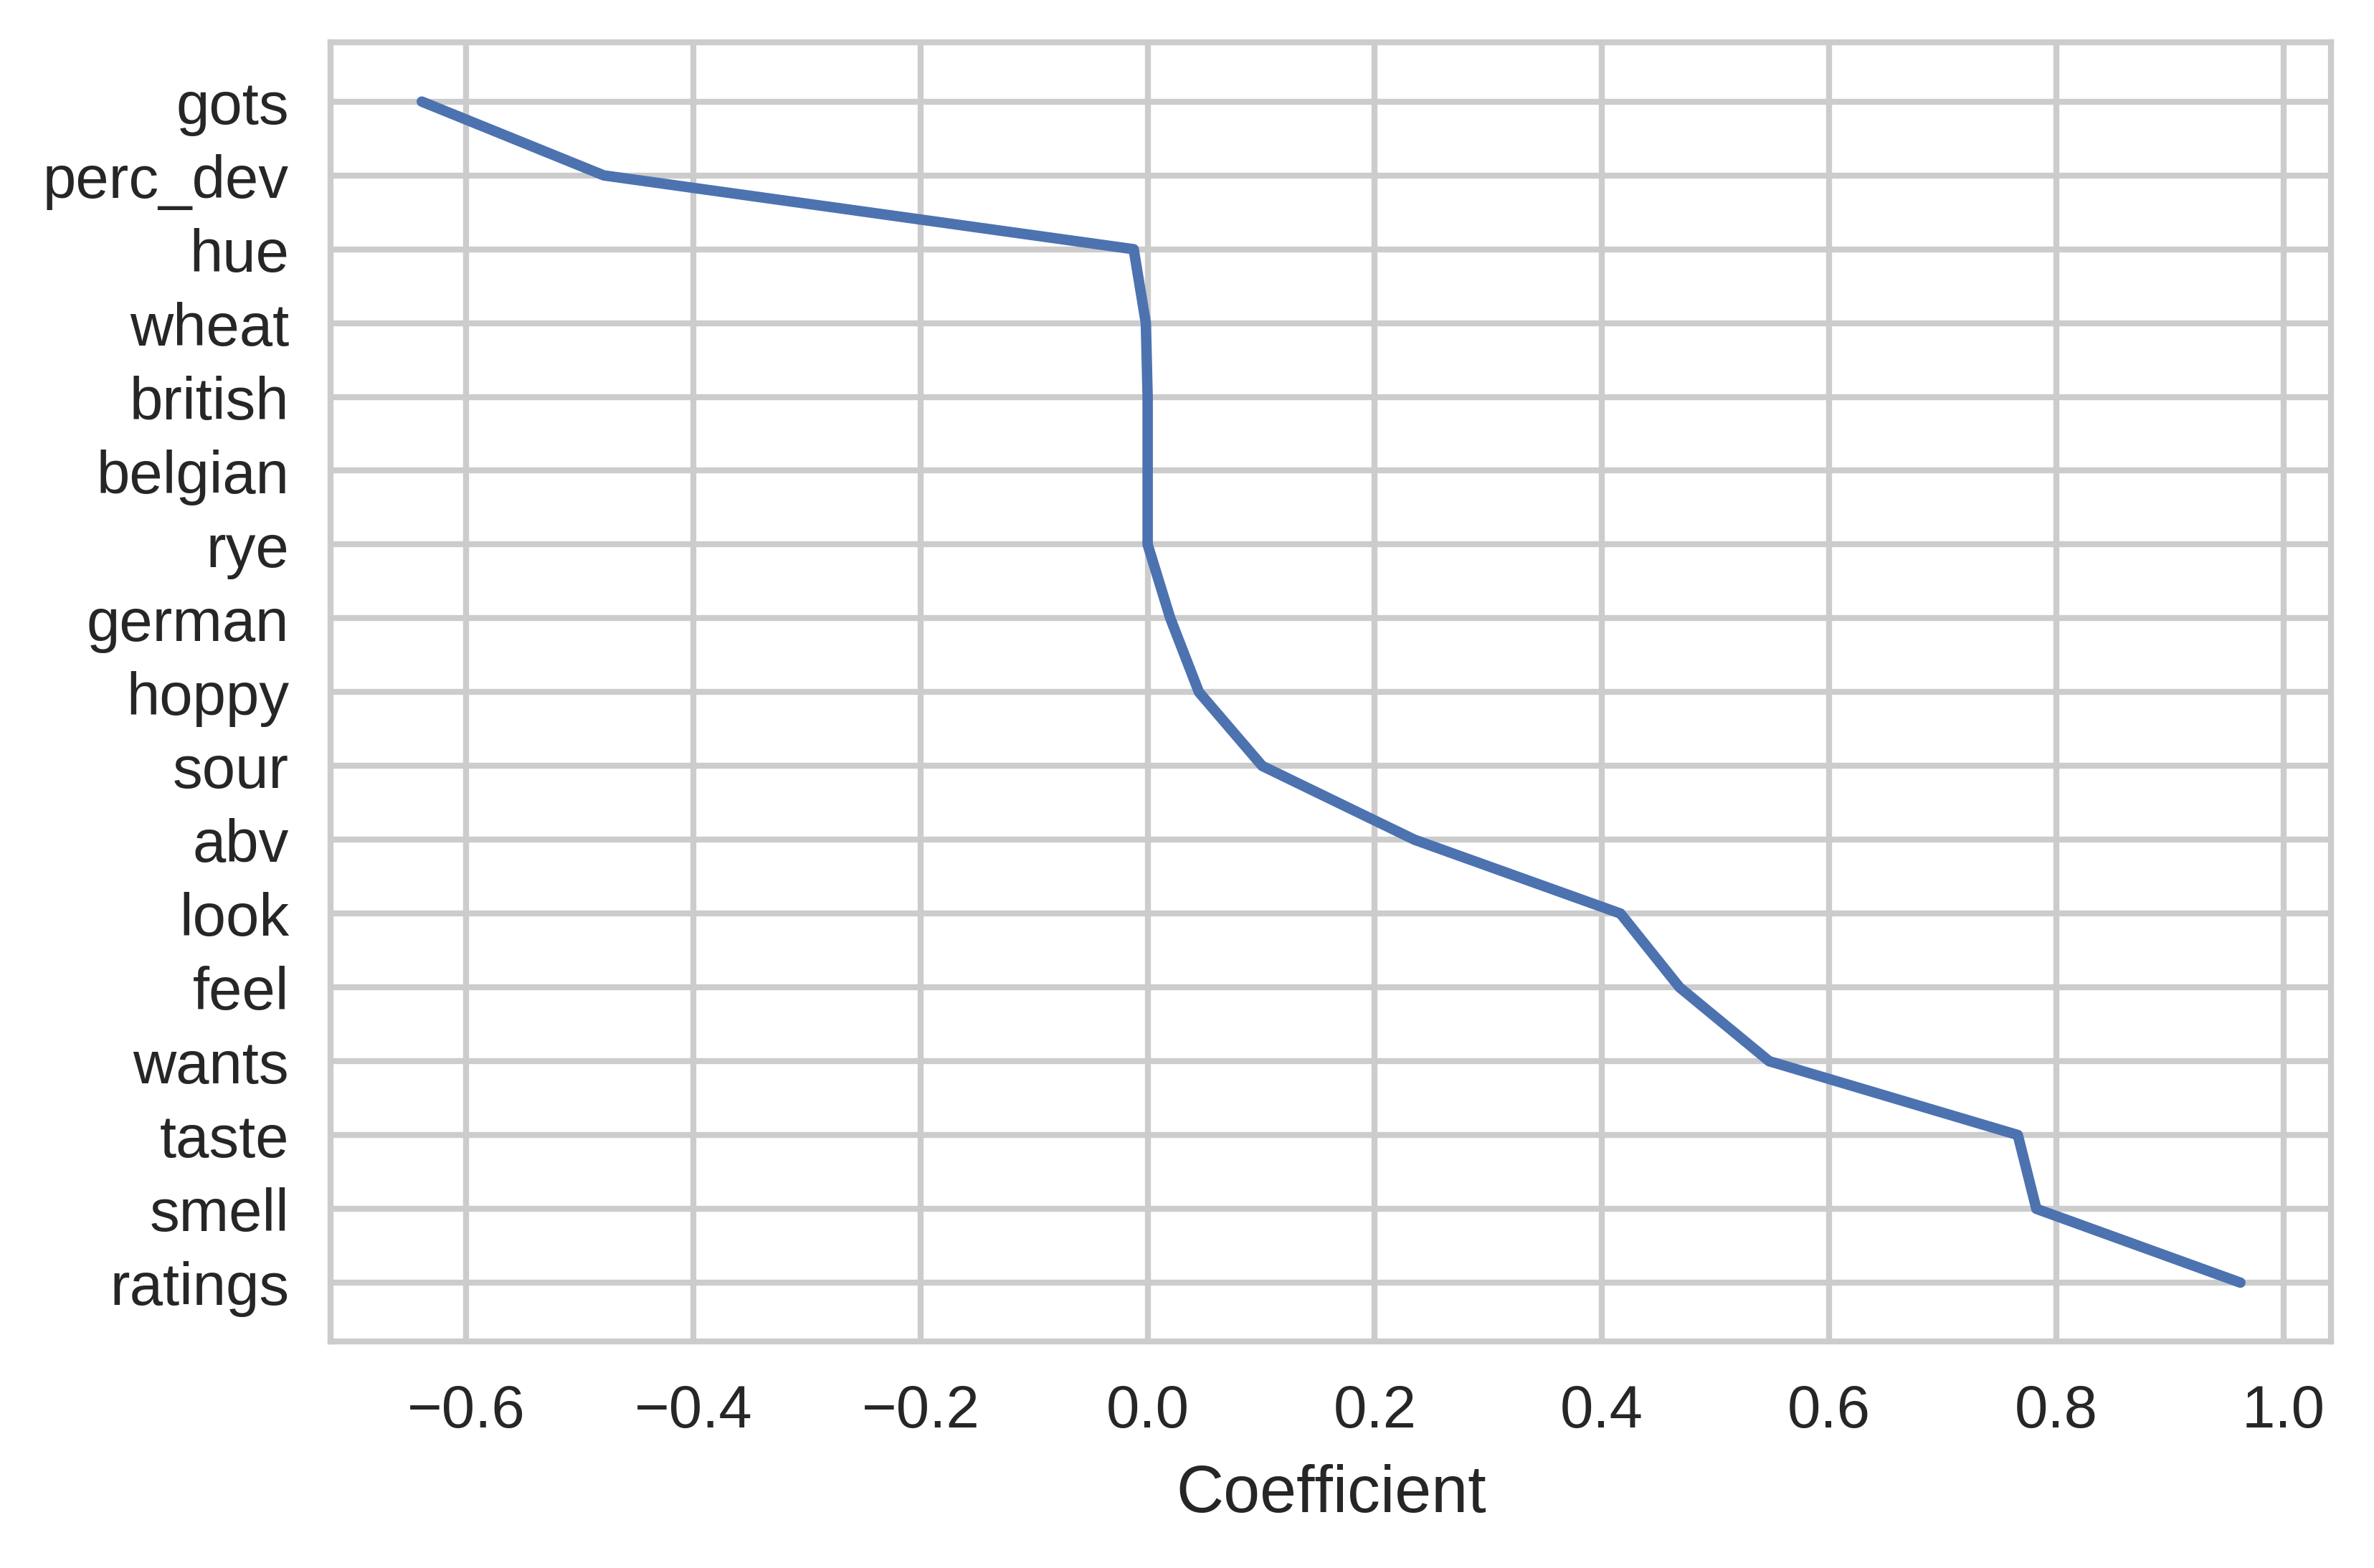
As discussed above, traits like taste and smell were strongly associated with a high rating (surprise, people like beer that tastes and smells good!) More interestingly, the number of ratings was strongly correlated with the BeerAdvocate score, which I interpreted to partially be a sign of hype. Traits that the brewer has more control over (hue, abv, etc.) played a more minor effect on the final rating, but I have plotted them below regardless:
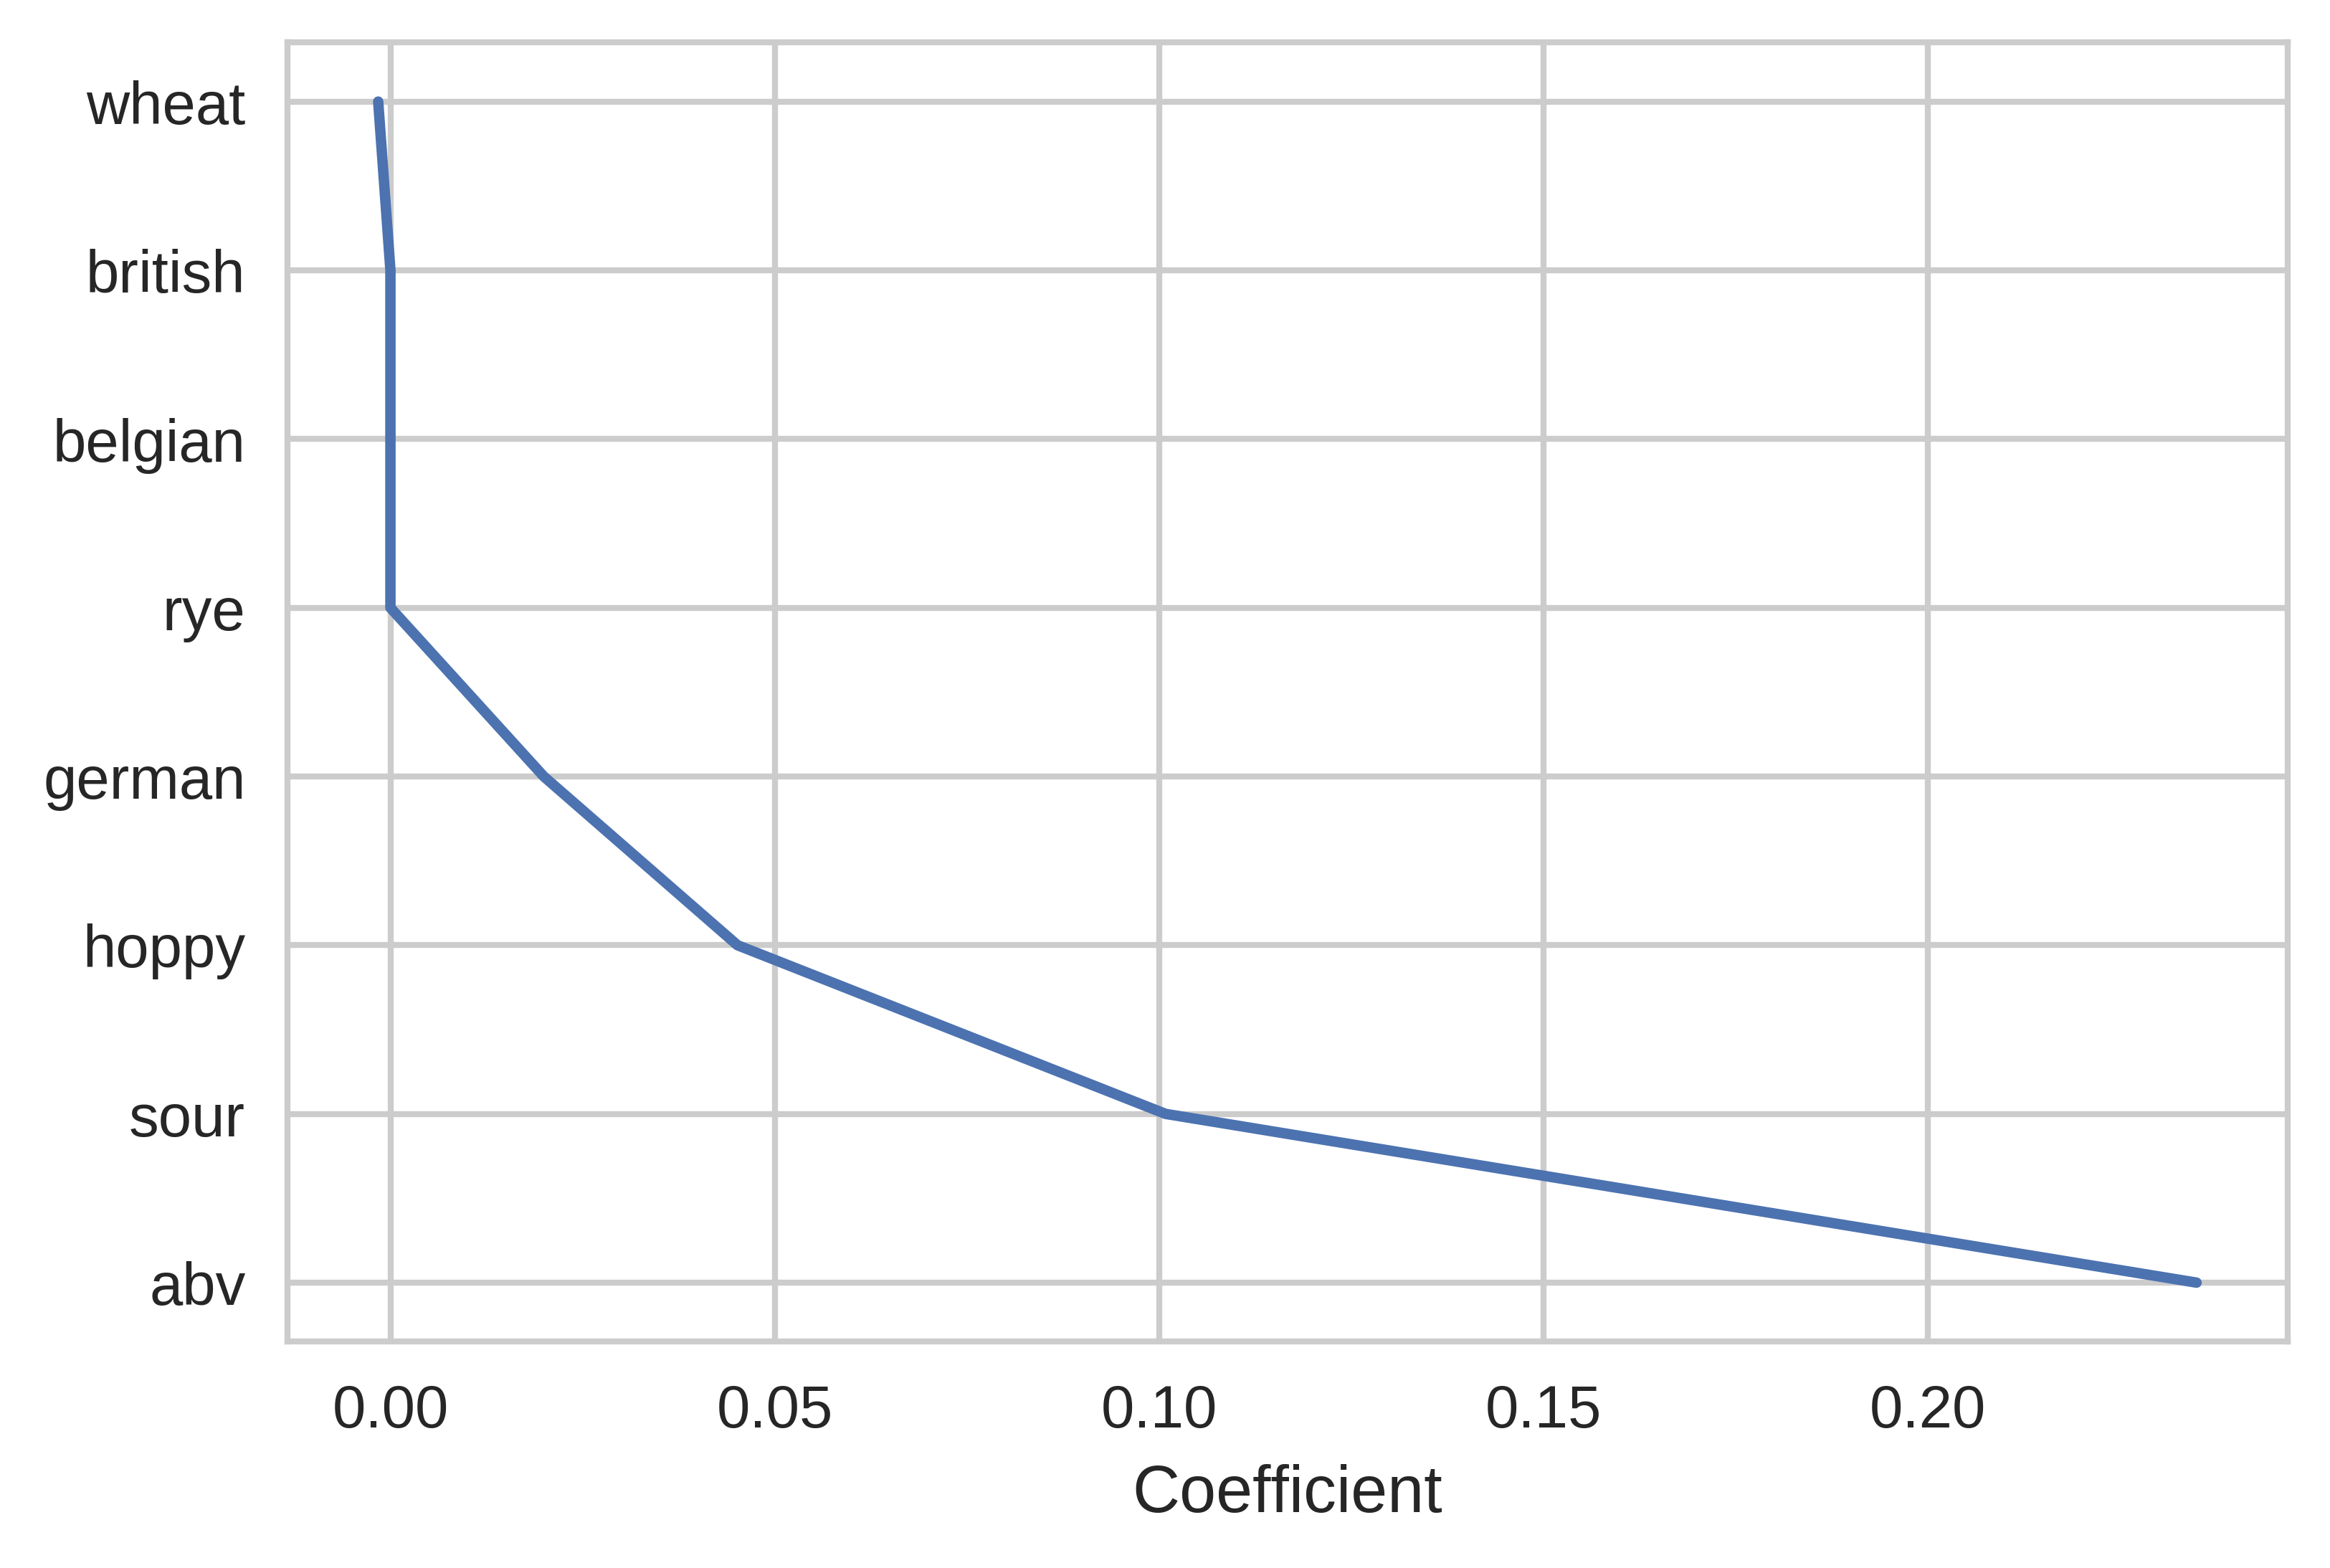
Here, we can see that hoppy, sour, and German beers along with beers high in alcohol tend to get better scores. Again, these effects are minor, so I would suggest focusing on marketing as I discussed above.